Molecular expression profiling with respect to KEGG hsa05219 pathway
Raghavendra Krishnappa
Life Science/Healthcare Vertical, MphasiS Limited, Chennai, India.
Correspondence to: Raghavendra Krishnappa, Email: raghavendrakbt@gmail.com and raghavendra.k01@mphasis.com
Abstract
One of the most promising avenues for interpreting large datasets of molecular expression profiles involves pathway-based analysis. Pathways are collection of genes and proteins that perform a well-defined biological task. These pathways have been established through decades of molecular biology research and are collected in a variety of public pathway repositories (KEGG and Reactome Pathway database). Understanding the complexity of these pathways is critical for understanding normal biological conditions and disease states and also since the number of known pathways within the cells is significantly smaller than the number of genes that is typically profiled, the transformation of data from a gene-centric view to a pathway-centred one represents a dramatic reduction in the number of dimensions. Such reduction allows a biologist to interpret and understand the data in a manner that is not possible when it is viewed as a collection of individual genes.
Introduction
Gene expression studies are used as an independent predictive method for prognosis. In cancer genomic studies, tremendous effort has been devoted to pathway-based analysis. Pathway analysis is a promising tool to identify the mechanisms that underlie disease, adaptive physiological compensatory responses and new avenues for investigation. Different pathways have different biological functions. Thus, it is reasonable to study each pathway separately. Among the many pathways, only a few have predictive power for cancer development. Among genes within predictive pathways, there are subsets having small to moderate predictive power, whereas the remaining are noisy genes [1–6].
Background
Genes have the inherent pathway structure, where pathways are composed of multiple genes with coordinated functions. The aim of this study was to identify genetic signatures associated with disease prognosis in bladder cancer with respect to hsa05219 pathway obtained from Kyoto Encyclopedia of Genes and Genomes (KEGG).
Methods
Microarray data files were taken from Gene Expression Omnibus (GEO), accession number GSE7476. Four different types of data files were generated from GSE7476 experiment by analyzing gene expression profiles in normal bladder tissues (controls), low grade superficial tumour samples (pathologically classified as Ta low grade, named as Ta), high grade superficial tumours with an unclear clinical behaviour (T1 high grade, named as T1) and high grade muscle invasive tumours (pathologically classified as T2, T3 or T4, named as T2+).
Data files representing controls and high grade invasive tumours (T2+) were compared for the current review work.
Affymetrix data files
Affymetrix gene expression chip was used for their study and the intensity values seen in the data file were log transformed values. One would subtract the control value from the experimental value to find the significant change in expression level. ‘Researchers generally’ use a cut off at least 2-fold change (linear value) between control and experiment to ‘screen significantly differentially expressed genes’.
Affymetrix does not have a certain threshold cut off that it recommends. Researchers in the community have seemed to adopt a value of about 100 (linear) so ~6.65 (log). However, this does not mean that a value of 6.8 is expressed in a sample; this is just a general guideline that many researchers have adopted to filter out a bulk of the probe sets. Most researchers will first analyze the data based on fold change, then filter on intensity when a probe set is <100 in both samples. A change from 3.5 to 4.8 in a sample could very well be just a background, where as a change from 6.0 to 7.4 might be real.
hsa05219 pathway
Pathway hsa05219 referring to bladder cancer was selected from KEGG pathway database (section 6.1 cancers http://www.genome.jp/kegg/pathway.html). There are totally 42 genes listed in hsa05219 pathway which are believed to be involved in causing bladder cancer (Tables 1–3).
Table 1:
Gene list from hsa05219 pathway showing affymetrix ID, gene name, and gene ID
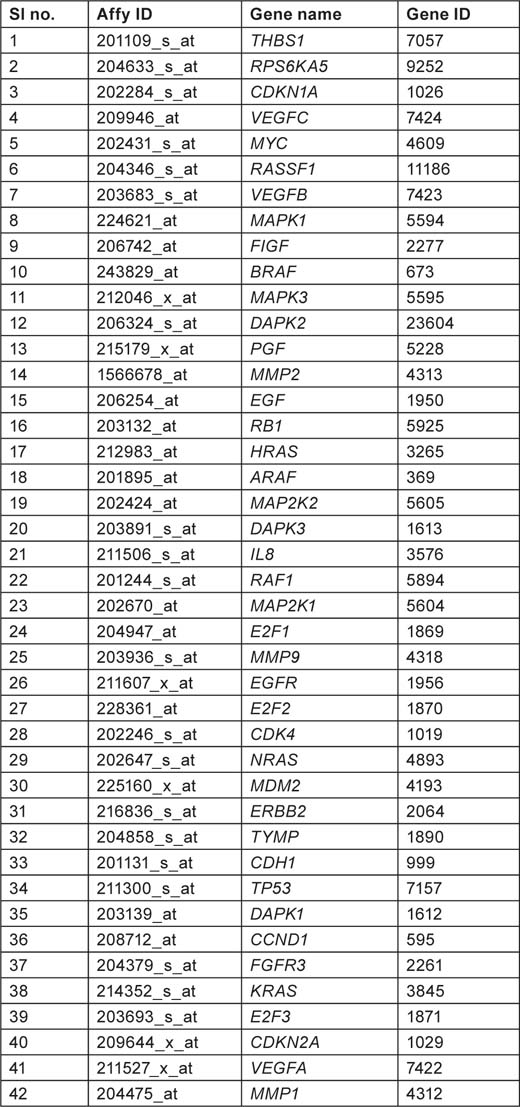
Table 2:
Displaying affymetrix grades and ID along with T2+ and control mean values
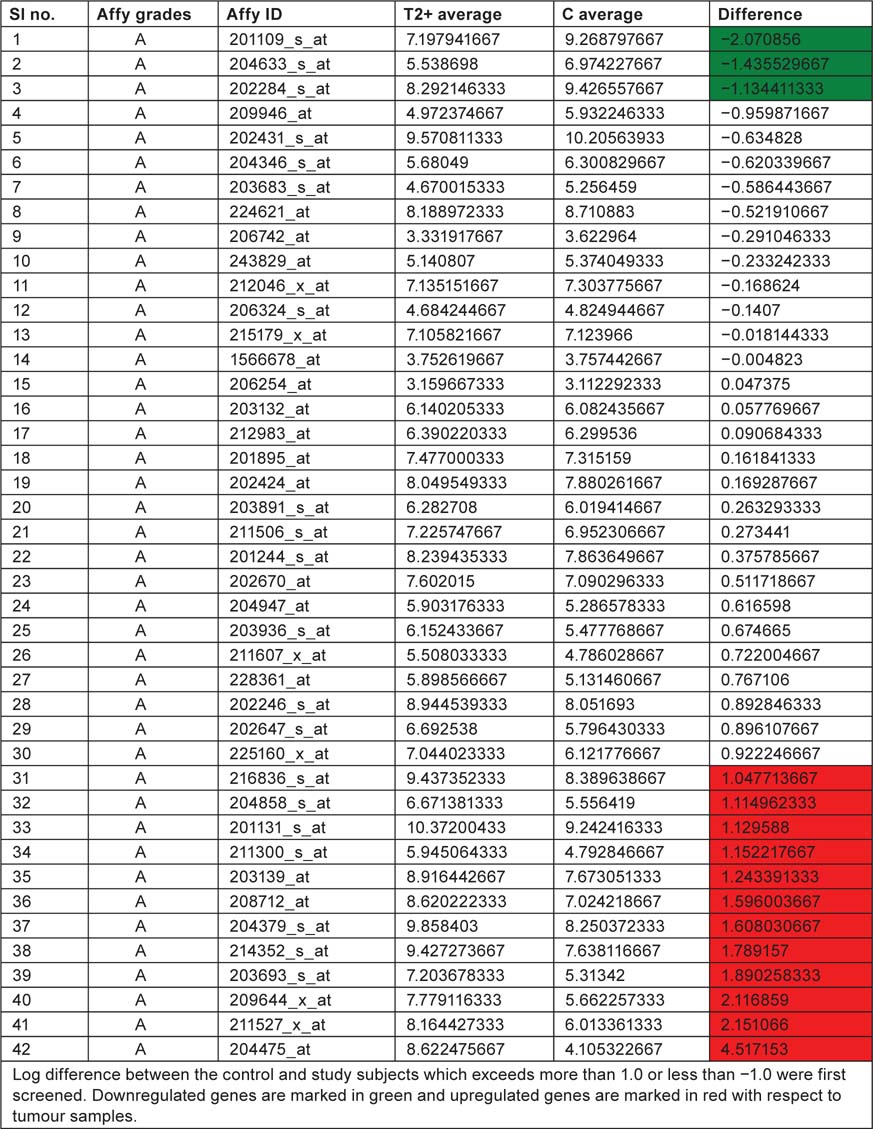
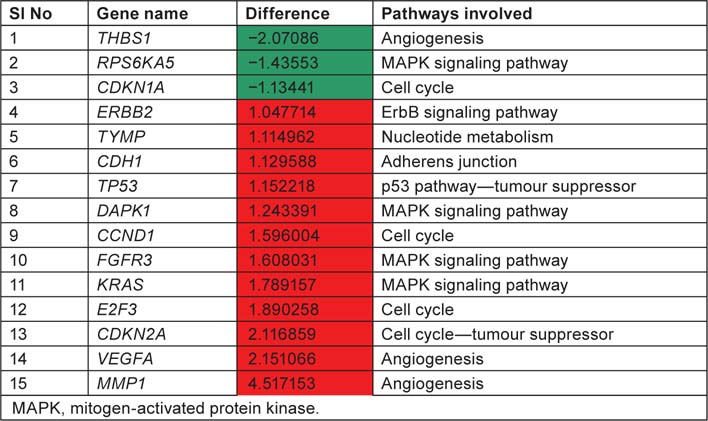
Table 3:
List displaying up and downregulated genes, downregulated genes are marked in green colour and up regulated genes are marked in red colour with respect to tumour samples
Conclusion
We have taken the list of genes associated with bladder cancer pathway from KEGG database. Log difference between the control and study subjects which exceeds more than 1.0 or less than −1.0 were first screened. THBS1, RPS6KA5 and CDKN1A are the genes which are highly expressed in control when compared with study subjects (T2+). These genes are associated with ‘angiogenesis’, ‘mitogen-activated protein kinase (MAPK) signaling pathway’ and ‘cell cycle’, respectively. ERBB2, TYMP, CDH1, TP53, DAPK1, CCND1, FGFR3, KRAS, E2F3, CDKN2A, VEGFA, MMP1 are the genes which are highly expressed in study when compared to control and these genes are associated with ‘ErbB signaling pathway’, ‘nucleotide metabolism’ ‘adherens junction’, ‘p53 pathway’, ‘cell cycle’, ‘MAPK signaling pathway’ and ‘angiogenesis’. By this current pathway analysis approach to the GSE7476 bladder cancer datasets, we can say that genes like ERBB2, TYMP, CDH1, TP53, DAPK1, CCND1, FGFR3, KRAS, E2F3, CDKN2A, VEGFA, MMP1 can be used as prognosis markers for bladder cancer gene expression study. Association of above 12 sets of genes for causing cancer was confirmed from Online Mendelian Inheritance in Man (OMIM) and articles from PubMed database. Further research is needed to evaluate whether the same gene signatures result from other bladder cancer profiling experiments (Table 4).
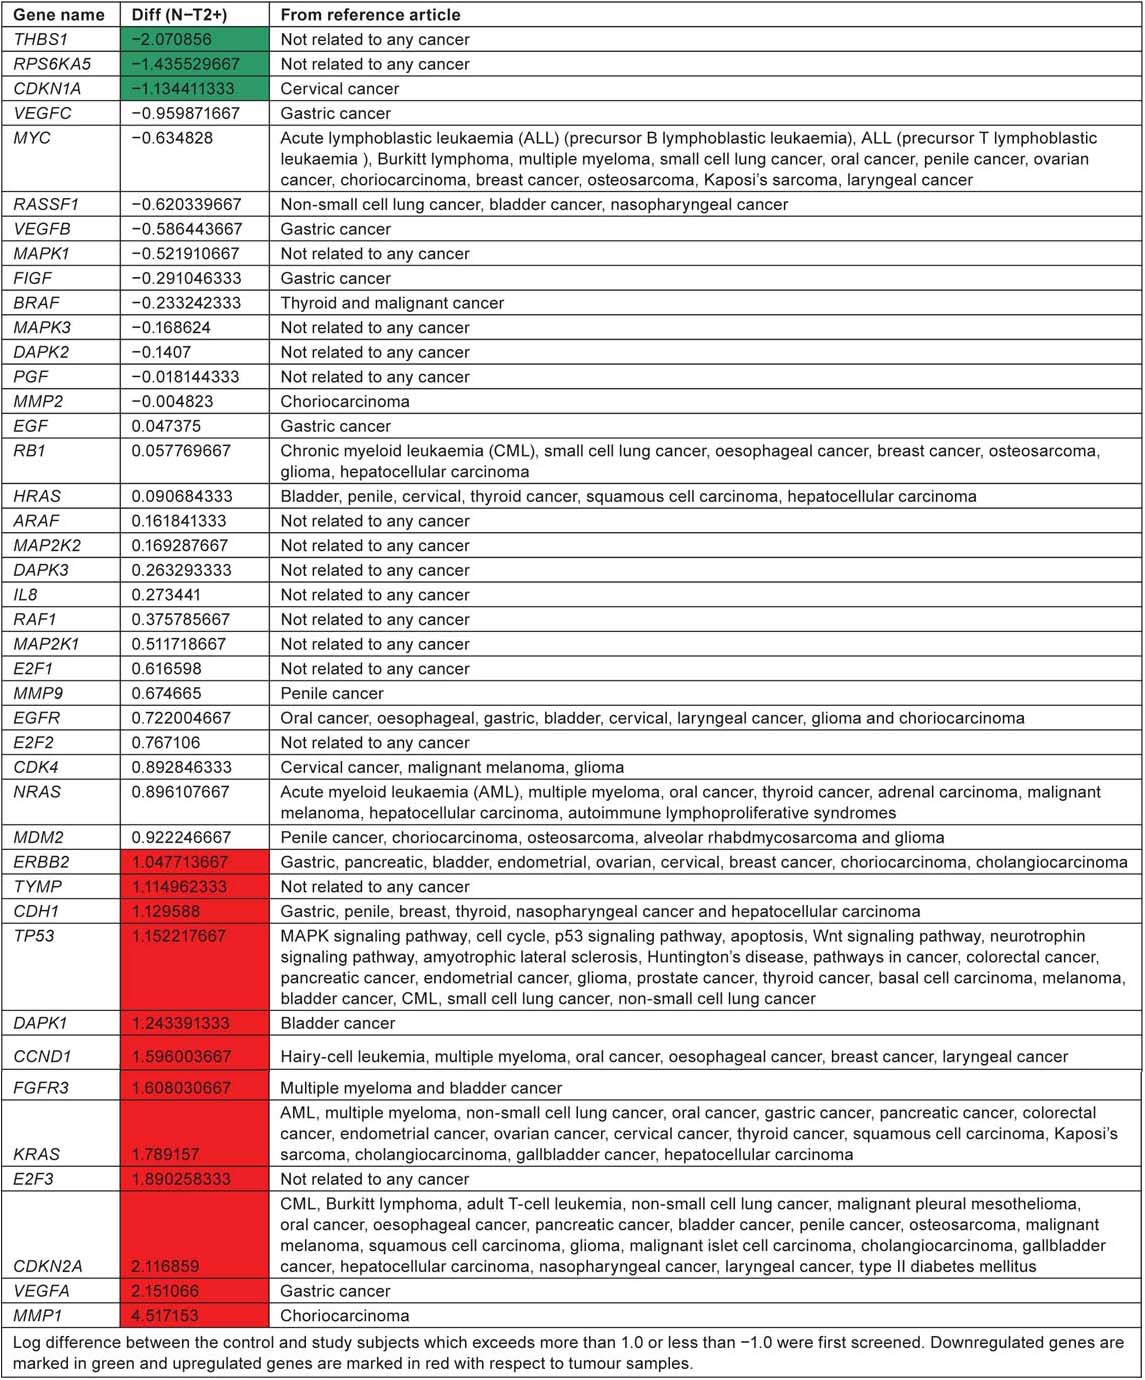
Table 4:
Genes from the hsa05219 pathway involved in different cancers
Difference in expression level
Significant findings
According to KEGG pathway, ‘hsa05219’ for bladder cancer, RB, CDKN2A and p53 are considered as tumour suppressor genes and FGFR3 and HRAS as oncogenes. Two of the tumour suppressor genes CDKN2A and p53 were expressed in significant level when compared with normal tissue samples. FGFR3 which is an oncogene is highly expressed in tumour samples compared to control tissue samples. CDKN2A, p53 and FGFR3 along with the other genes ERBB2, TYMP, CDH1, DAPK1, CCND1, KRAS, E2F3, VEGFA and MMP1 are unregulated in tumour tissue samples. All these genes play an important role in ErbB signaling pathway, nucleotide metabolism, adherens junction, p53 pathway, MAPK signaling pathway, cell cycle and angiogenesis. THBS1, RPS6KA5 and CDKN1A are downregulated in tumour tissue when compared with control tissue samples. Out of the 42 genes listed in the KEGG bladder cancer pathway, only eight genes RASSF1, RB1, HRAS, EGFR, ERBB2, DAPK1, FGFR3 and CDKN2A have reference support to prove their involvement in causing bladder cancer. This current review suggest the lack of research/involvement of the other genes in the pathway to cause bladder cancer. Pathway analysis of affymetrix data file shows upregulation of four genes ERBB2, DAPK1, FGFR3 and CDKN2A which have reference to prove their involvement in causing bladder cancer.
References
1. Pant-Purohit M,
2.
3. Apolo AB,
4. Shariat SF,
5. Bryan RT,
6. Chopin DK,


